

The London Companion Market Report 2026
Three Years of Booking Trends, as Observed by London Escorts VIP (2024–2026)
This report shares market trends as observed through London Escorts VIP's own booking data. It draws on a real, three-year operational dataset from one of London's premium companion agencies, prepared by our internal team from anonymised booking records covering January 2024 to June 2026. It reflects our own client base and operations, and it isn't a claim about every agency in London.
Executive Summary
We looked at our own booking records from January 2024 to June 2026: just over 3,400 completed bookings after we excluded cancellations and incomplete enquiries. This is our own operational data, so treat the percentages as directional for an agency of our size and client base. They're specific to us, and shouldn't be read as a statement about London as a whole. A few things stood out enough that we think they're worth sharing.
Nationality mattered a lot for first-time clients and then mattered a lot less. Repeat clients cared more about reliability and communication than anything demographic. That one came up in feedback often enough that we went back and checked it against the booking-order data, and it held. Weekend bookings grew faster than the rest of our bookings. Mayfair is still our biggest single area by volume, though Belgravia and Chelsea have both picked up share over the three years. That doesn't look like it's coming obviously at Mayfair's expense; demand looks like it's spreading out generally instead. Summer isn't just "busier" for us; the mix of booking types shifts too, which we didn't expect going in.
About This Research and Its Limits
The dataset covers completed bookings only, logged between January 2024 and June 2026, tagged internally by type (dinner, event, travel, weekend, business), duration, London area, month, and (where a client mentioned it unprompted during first contact) country of origin. Nationality wasn't asked as a form field; it's whatever came up in conversation, so it's patchy and probably skews toward clients who talk more during booking. That's a real limitation we haven't corrected for.
No correspondence, images, or anything identifying is stored or was reviewed for this report. Every percentage below is based on categories with at least 30–40 bookings in them; a few of the smaller nationality and area breakdowns are close to that floor, so single-digit percentage differences in those rows likely don't mean much. Our own booking-operations team pulled and reviewed this data; it hasn't gone through a third-party research firm or peer review. It's worth saying plainly: the numbers below could otherwise look more authoritative than they are, and they describe our client base specifically rather than the market at large.
Nationality Trends
First-time booking requests by nationality (n≈1,050 first bookings): British 27% · Eastern European 19% · Italian 14% · French 11% · Spanish 9% · Brazilian 8% · Other 12%.
Historically, people have assumed nationality drives who a client wants to book, and our first-booking numbers above look like they support that. But the pattern only shows up at the very start. A client without prior experience of our service tends to lean on what feels familiar (shared language, an expected rhythm to how a dinner or evening goes) because that's one less unknown on a first booking.
This suggests the pattern is more closely linked to familiarity than to a fixed nationality preference. The clearest evidence is what happens next: the effect is mostly gone by the second booking (Section 4 has the numbers). If clients actually preferred a nationality, that preference should hold steady booking after booking. In our data, it doesn't.
Repeat Bookings
How much nationality shapes a client's choice, by booking order (first booking = 100, n≈310 clients with 4+ bookings): First 100 · Second 61 · Third 34 · Fourth+ 18.
Somewhere between the second and third booking, the thing clients seem to be optimising for changes. Feedback from our repeat clients mentions three things far more than anything else: whether confirmations are reliable and on time, how fast and clearly messages get answered before a meeting, and whether the pace of conversation matches. Some clients want more talking, some want less, and getting that wrong is a bigger complaint than we'd anticipated.
A new client and a client on their fifth booking are, in a lot of ways, responding to different things entirely. Marketing that leads with photos and first-impression details does the job it's supposed to do for acquisition. It doesn't explain why someone comes back a second or third time. That comes down to fairly ordinary service basics: showing up when you said you would, replying without a two-day gap, reading the room instead of running a script.
Booking Types
Distribution of bookings by type: Dinner 38% · Event 24% · Weekend 19% · Business 12% · Travel 7%.
Dinner is our default, the lowest commitment on both sides and the easiest to move if plans change. The static split is less interesting than the direction of travel, though: weekend bookings grew faster than any other category over the three years, and business stayed essentially flat the whole time.
Events and business bookings both move with something external (event season, a client's work travel schedule). Weekend bookings mostly don't. Someone booking a weekend with us is usually just deciding they want the time, on their own schedule, without much of an external prompt behind it.
Booking Duration
Average duration by type: Dinner ~5 hours · Event 4–5 hours · Business 5–6 hours · Travel 2–3 days · Weekend 1.5–2 days.
Dinner, event, and business bookings cluster fairly close together in length, which surprised us a little. We'd assumed dinner would be shorter across the board. Travel is the clear outlier on the high end. The category that actually needed a second look was weekend: the spread inside it is wider than anywhere else, with some clients booking a full two days and others just an evening and the following morning. That's likely two different things people mean by "weekend booking" lumped into one, though the data as tagged doesn't let us split it further.
Our Coverage Across London
Mayfair is still our biggest single area, mostly because of the hotels and restaurants nearby and how close it sits to the business districts, which makes it a workable default almost regardless of what a client is booking for.
Belgravia is quieter, and it's where a lot of our longer and business-leaning bookings land; it's also grown faster than most other areas over the period. Chelsea skews more casual: dinners and events over business meetings. Knightsbridge holds a small, fairly constant share, tied to the shopping and hotel activity in the area. City is almost entirely business bookings, and almost entirely on weekdays.
Historically, our clients often defaulted to Mayfair somewhat automatically. Our data suggests that's loosening. Clients seem to be picking an area based on what they're actually doing that day, rather than reaching for the obvious choice by default, and Belgravia and Chelsea aren't obviously the direct beneficiaries of that shift.
Seasonality
Monthly demand index (100 = yearly average): Jan 78 · Feb 92 · Mar 96 · Apr 101 · May 108 · Jun 114 · Jul 119 · Aug 96 · Sep 110 · Oct 105 · Nov 99 · Dec 108.
June and July are our peak, which lines up with business-event season, the social calendar, and tourism all landing at roughly the same time. August was a genuine surprise; despite being holiday season broadly, our bookings dip, probably because a chunk of our business-travel client base leaves London for the month along with everyone else. December has a smaller bump that's almost entirely down to the corporate year-end calendar; business bookings specifically climb well above their average that month even though total volume is calmer than autumn.
Weekend bookings don't follow this curve at all closely. Dinners track the business calendar almost month for month. Weekends peak earlier, around late spring, and stay elevated through most of summer regardless of what's going on in the City that week, closer to how people plan a holiday than how they plan a meeting.
Five Key Findings
New clients lean on nationality and first impressions when they book with us for the first time. By the third or fourth booking, that's mostly gone from the feedback we see. That's not a small gap; it means a lot of standard marketing in this space is optimised for the wrong stage of the relationship.
Weekend bookings are the fastest-growing category for us, and they're also the one clients seem to book on their own initiative rather than around something else on the calendar, like a trip or a work commitment. Business travel just tracks whatever's happening in someone else's schedule, which likely explains why it's stayed flat.
Mayfair's share has slipped a bit in our data, though it's not a simple story of clients switching to Belgravia or Chelsea instead. The more deliberate, day-to-day choice of area described above explains it better than a straightforward swap between neighbourhoods would.
Once a client has booked with us a few times, small operational things (a late reply, a missed confirmation) matter more to them than we expected, and more than most of the marketing angles we see in this industry account for.
None of this is dramatic on its own. Taken together, it suggests the things that get someone to book once and the things that get them to keep booking are almost unrelated, at least for our client base. That's an important point, even though it complicates the pitch.
Conclusion
Over three years, the picture that comes out of our own booking data is a client base splitting into more specific patterns than it used to have. Nationality matters at the start and stops mattering fast. Weekend demand is growing on its own logic, separate from business travel. Where someone books is starting to depend more on what they're doing that day than on habit. We'd expect that to continue for us, more specific, planned bookings, and less of the demand driven by broad categories like nationality or area on their own.
All data in this report is drawn from London Escorts VIP's own anonymised booking records and reflects market trends as observed through our operations, not a survey of the wider London industry.
-
 W2 London Explained: What the Postcode Covers, Street by StreetOct 21, 2026London has two Edgware Road stations, but only one is in W2. Discover what this postcode actually covers, from Paddington and Bayswater to Lancaster Gate, and which Underground stations serve each area.Read more...
 -
 Russian, British and Brazilian Escorts in London: Culture, Character and First ImpressionsOct 15, 2026Russian, British and Brazilian escorts in London: their cultural traditions, humour, ways of communicating and the misunderstandings that can arise from first impressions.Read more...
 -
 Filming With a Mask: The Look Is Half the StoryOct 07, 2026With her face covered, the eyes, outfit and mask do most of the visual work. Lace or satin, black or red, and what works best with each.Read more...
 -
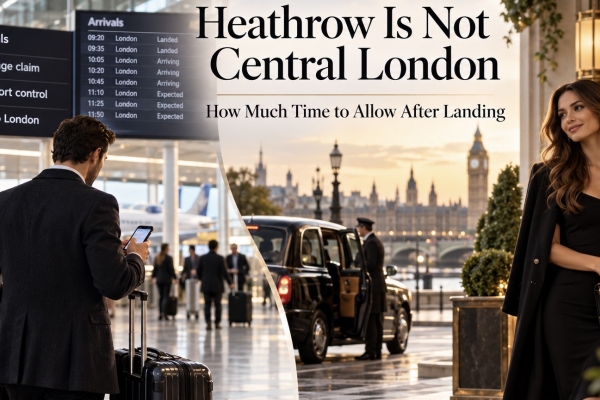 Heathrow Is Not Central London: How Much Time to Allow After LandingOct 01, 2026Landing at Heathrow with a booking in London the same day? Passport control, baggage and the trip into town all take time. This article explains how long to allow and which train suits which part of the city.Read more...


